Scrum Dashboard
When you create a Scrum team, you can take advantage of the metrics.
This new DoneTonic feature allows you to create charts to evaluate and improve the performance of your teams. These metrics help to:
- Measure progress: Track the advancement towards sprint and project goals.
- Identify impediments: Early detection of obstacles that may delay work.
- Improve planning: Optimize the estimation and task allocation in future sprints.
- Foster transparency: Provide clear and shared information about the project’s status.
- Promote continuous improvement: Evaluate the team’s efficiency to implement constant process improvements.
In summary, the metrics provided by DoneTonic are fundamental to the success of projects and/or products, as they provide objective data that guides decision-making, improves planning, and facilitates the detection and resolution of problems, all while fostering a collaborative and transparent work environment.
How to create a new chart in DoneTonic
First of all, to be able to create and/or edit charts in DoneTonic, you must have the corresponding permission.
If you don’t have it, you should ask your workspace administrator. In the same navigation menu, the administrator can go to the Administration section > Manage users. There, select the user and click on Permissions.
From there, they can activate the permissions to create or edit charts.
Now let’s see how to create your first chart:
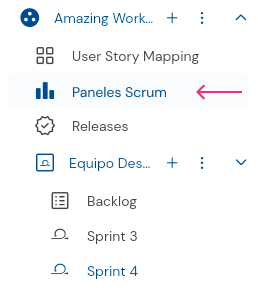
- In the navigation menu, go to the Scrum Dashboard section:
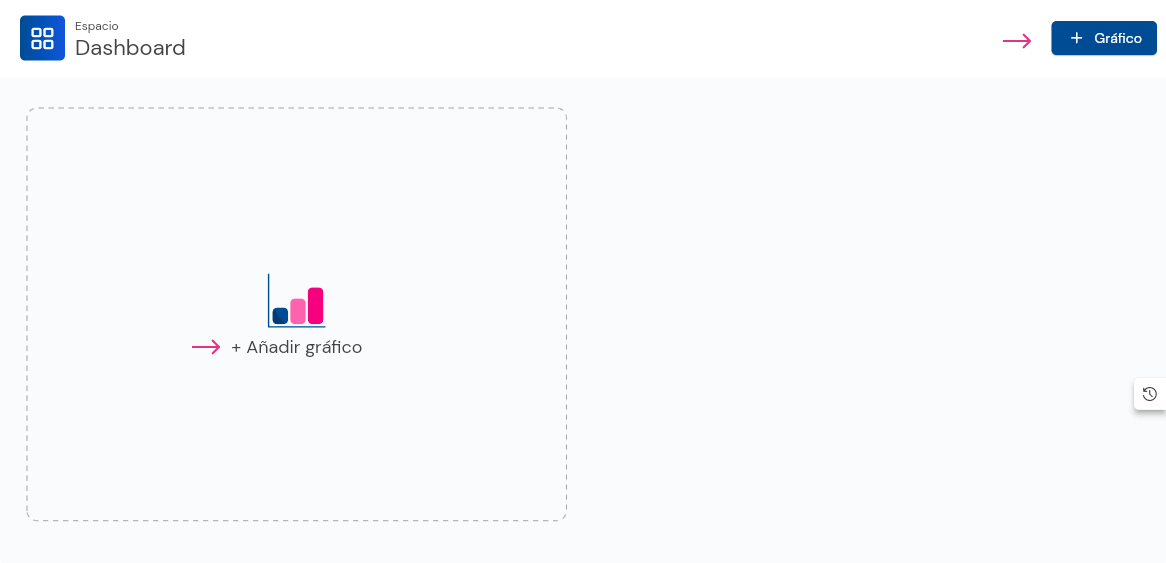
- There, click on the “Add Chart” button:
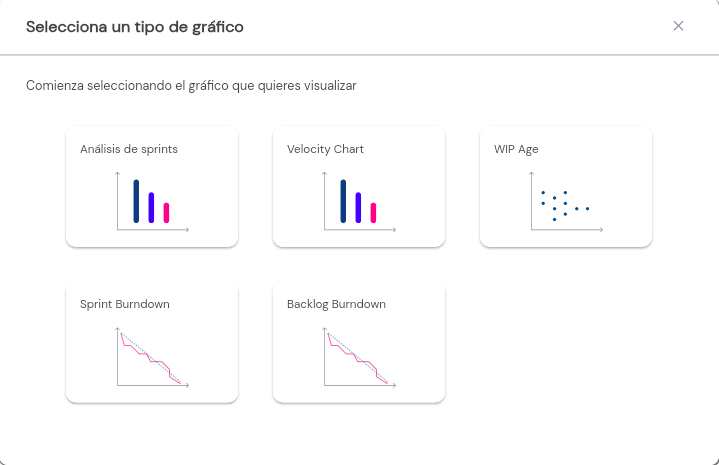
3.Select the type of chart you want to add:
- Customize your chart and you’re done!
Dashboard Permissions
Dashboards are visible to all team members as part of Scrum’s transparency principle, but to edit and/or create charts, you need permission from the Administrator.
Editing Dashboards
You can edit a chart by clicking on the more options button. There, you can edit the data or also delete the chart.
What charts can you find in the Scrum Boards of DoneTonic:
Sprint Analysis:
- Description: Provides an analysis of the PBIs in each Sprint. You can see how many PBIs were completed, blocked, and/or canceled during each sprint.
- Objective: Offers feedback on what worked well and what didn’t, identifying areas for improvement for future sprints. It is essential for continuous improvement and adapting the work process.
Velocity Chart:
- Description: Measures the amount of work a team completes in a sprint.
- Objective: Helps predict how much work the team can take on in future sprints, improving planning and task estimation. It is a key metric for measuring the team’s performance and capacity.
WIP (Work in Progress) Age Chart:
- Description: Measures the age of a PBI (Product Backlog Item) in WIP. It calculates how long a PBI has been in progress (WIP) from when it started to the current moment.
- Objective: Helps identify PBIs that are taking too long, which can indicate blockages or bottlenecks. It is useful for maintaining an efficient workflow and minimizing cycle time.
Backlog Burndown Chart:
- Description: The Backlog Burndown Chart shows the amount of work remaining in the project backlog over time.
- Objective: Helps teams monitor the overall progress of the project/product and determine if long-term goals are being met.
Sprint Burndown Chart:
- Description: The Sprint Burndown Chart shows the amount of work remaining in the current sprint, usually in terms of story points, hours, or tasks, over the duration of the sprint. This chart is updated daily and shows how the team is progressing towards completing the planned tasks for the sprint.
- Objective: Provides a clear daily view of the team’s progress towards sprint goals, allowing early detection of deviations and potential problems.
Get to know more: