Sprint Analysis:
This is a key chart in agile project or product management, used to evaluate and improve the performance of each sprint. It allows you to identify achievements, obstacles, and areas for improvement, ensuring that the team can adapt and optimize its efficiency in future sprints.
How to create a Sprint Analysis chart in DoneTonic
First of all, you need to keep in mind that for this chart to show data, you must have at least one closed sprint. This means the review (completion) date of the sprint has already passed.
To create the chart, go to the Scrum Boards section and there select Add Chart > Sprint Analysis.
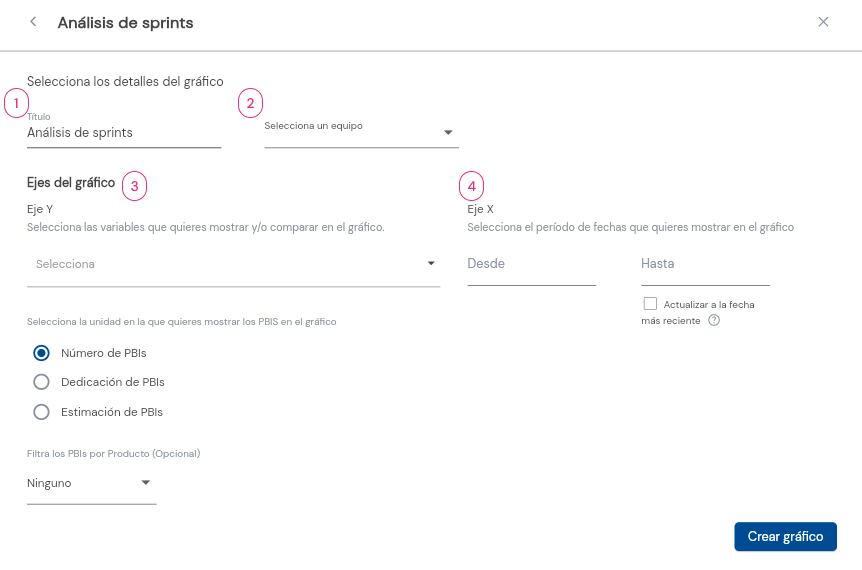
A window will open where you can select the chart parameters:
- Name the chart.
- Select the team whose sprints you want to analyze. If you need to analyze the sprints of multiple teams, we recommend creating a chart for each team.
- Y-axis: Select the PBI variables (assigned PBIs, blocked PBIs, etc.) you want to display and compare in the chart. You can choose as many variables as you like. It’s important to always choose at least 2 variables to compare.
Here you can also choose whether you prefer to view the PBIs as units, estimates (story points), or dedication (hours logged for each PBI).
Additionally, if you work with User Story Mapping and with more than one product/project at a time, you can filter the PBIs by product/project. Example: If your team works on 2 products or projects but you only want to evaluate the progress of one product, this option allows you to filter it.
- X-axis: Select a date range.
If you want the chart to update continuously, check the box to update to the most recent date.
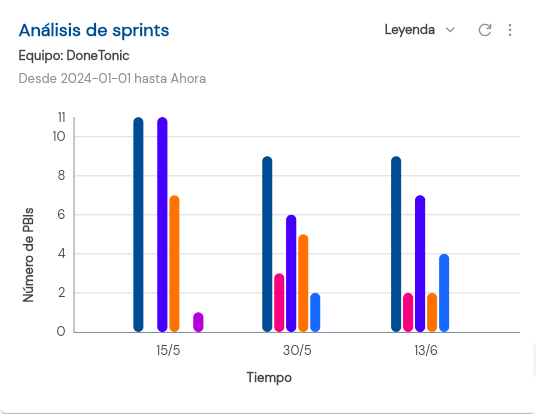
 Here is an example of how a Sprint Analysis chart is displayed:
Edit Chart:
To edit the chart, simply click on the more options button located at the top right.
Update Chart:
If you selected the option to update the period to the most recent date, click on the refresh button located at the top right of the chart to update the data.
Remember that only members with the appropriate permissions can create and/or edit charts.